PTE Academic Describe Image Emergency Tips/ Tricks/ Techniques
Suppose there are lots of variables in Image and you get confused that how to explain images, the second emergency is if the image is totally unknown and you don’t understand anything at all. So how can we deal with it?
PTE Academic Describe Image Emergency Tips/ Tricks/ Techniques
Just keep on talking, it’s better than being silent because this is a speaking test and we should keep on talking, no matter what, just make fluency and pronunciation good and don’t worry about the content in case of emergencies.
For example, this is the map –

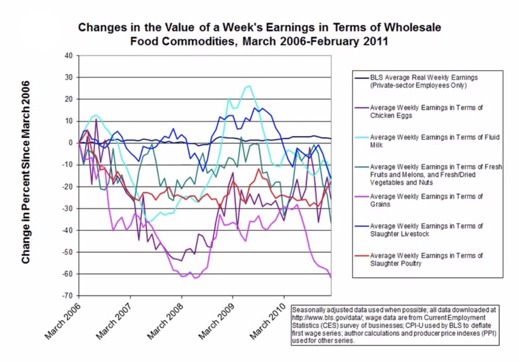
In this lots of variables are given and we don’t even understand what it is? So make sure you follow the same format in preparation time. We are going to look at the type of the image, line graph, the heading, changes in the values of week’s earning in terms of wholesale food commodities from March 2006 to February 2011. If you don’t understand anything just read it. X-axis/ Y-axis change in percentage since March and there are a lot of variables. So in this case when the microphone opens just to make sure you talk anything. Just like we can say the first sentence according to our format.
The line graph shows changes in the values of week’s earning in terms of wholesale food commodities from March 2006 to February 2011. In case of average weekly earnings in terms of fluid milk in March 2009 it was maximum. On the other hand in March 2008 the change in average weekly earning in terms of grains was minimum and in Feb 2011 the average weekly terms of grains were also minimum. The BLS average real weekly earnings in private sector employees only were constant throughout the whole period. In conclusion: We can say that the private sector employees earning were constant during the whole period. On the other hand, minimum changes took place in average weekly earnings in terms of grains.
So technically, I know it didn’t make any sense and I couldn’t even understand what I just said. I couldn’t even understand what this graph explained to us. What message it conveyed, but technically I spoke for 35 seconds. So make sure in emergency conditions keep on talking. You can pick any variable, and I always recommend to pick maximum/ minimum and exception. But if you can’t pick any variable, like in this case just try to pick anything other like average weekly earning in terms of slaughter livestock was approximately 0% in March 2006 and then after so many fluctuations, it becomes maximum in March 2009. Then after that, it decreased significantly.
On the other hand, the average weekly earning in terms of fresh fruits and melons, and fresh dried vegetables and nuts was approximately 10% in March 2006 and then it shows so many variations and fluctuations and it becomes minimum in February 2011. So this how just pick any variable, pick anything and keep on talking for 40 seconds because if you don’t understand the graph, don’t keep silence. Make sure you talk anything at all. So at last just keep on talking as explained earlier and if you keep silent in one describe then it will impact overall score of speaking because fluency and pronunciation are just accessed as an ongoing process. Do not get your fluency and pronunciation suffer from the content.