Describe Image PTE Answers Table Graph Diagram – Practice Sample 15
Describe Image (TABLE DIAGRAM) – Study the table in 25 seconds and describe it in 40 seconds. Here is Describe Image PTE Answers Table Graph Diagram – Practice Sample 15.
Important Note: You are not expected to explain the whole image in 40 seconds. Just explain the key points.
In case you find it difficult to explain, learn how to describe an image.
Describe Image PTE Answers Table Graph Diagram – Practice Sample 15
# Describe the given Table.

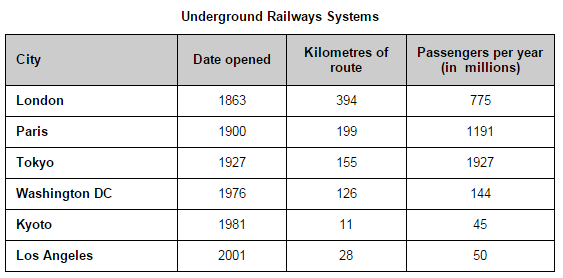
The table shows data on underground railways systems measure in millions of passengers in six metropolitan cities namely London, Paris, Tokyo, Washington DC, Kyoto and Los Angeles. The highest number of passengers were recorded at Tokyo railway system with 1927 passengers followed by 1191 passengers at Paris. The least number of passengers and route were found at Kyoto with 45 passengers and 11 kilometres respectively.
You Might Also Be Interested In:
PTE Reading Reorder Paragraphs Practice
Short Questions With One Word Answers PTE
# Describe the given Table.

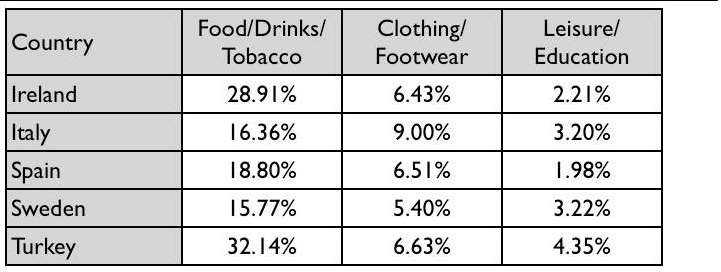
The table shows the information about consumer spending on different items in five different countries in 2002. Turkey spent the highest money on food, drinks & tobacco that was 32.14% and least money in leisure & education that was 4.35%. Italy spent the highest money in terms of clothing & footwear and Spain spent the least money on leisure & education that was 1.98% among all countries. To conclude, we can say that all countries spent its most of the money on food, drinks & tobacco where spending on leisure & education was least preferable.
Related Category: Describe Images For PTE Exam
To stay updated, like us on Facebook.