Describe Image PTE Practice With Answers
Describe Image PTE – You have 25 seconds to recognize the image. Describe the image including important keywords in your own words in about 40 seconds. Here is – Describe Image PTE Practice With Answers, Practice Test No. 6.
In case you find it difficult to explain Describe Image PTE, learn how to describe image in PTE from our experts.
Don’t forget to write your own answer in the comment box.
Describe Image PTE – Practice Test 6
# Describe Image PTE Practice Question no. 1

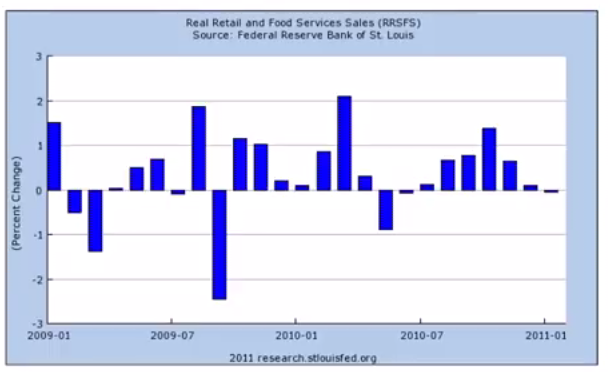
This graph represents the percent change in Real Retail and Food services sales in the city of St. Louis for the year 2009 to 2011. In the year of 2009 started with positive trend followed by few negatives. The highest negative change was seen in the second quarter of 2009. In the year 2010, the trend stayed positive most of the time. In conclusion, there was a positive trend for sales in the city of St. Louis for the two year period with few exceptions.
# Describe Image PTE Practice Question no. 2

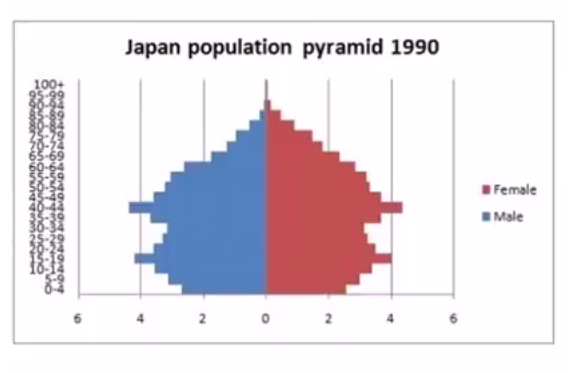
This image compares the gender wise population of Japan during the year 1990. For both males and females, the highest population was seen for age groups between 15 to 19 and 40 to 44. The lower population age groups of over 70 years of age. In conclusion, In Japan, there is an equal number of males and females with slightly more number of females in the age groups of over 70 years.
# Describe Image PTE Practice Question no. 3

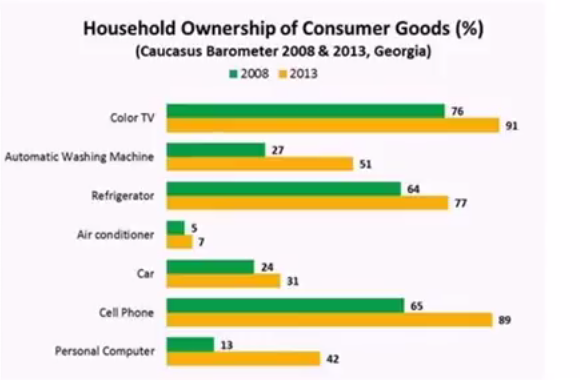
This graph compares the percentage ownership of Consumer Goods in the year 2008 and 2013. During both years Color TV was the most common item, while Air Conditioner was the least common item in the households. During the year 2013 cellphone became the second most popular item which is closely followed by Refrigerator. Surprisingly Personal Computer was not very popular. In conclusion, it seems that people spent more money on entertainment units than on essential items like a Personal Computer.
To stay updated for more Describe Image PTE Questions along with Answers, like us on Facebook.