PTE Describe Image Practice With Answers – Practice Samples
PTE Describe Image – You have 25 seconds to recognize the image. Describe the image including important keywords in your own words in about 40 seconds. Here is – PTE Describe Image Practice With Answers for our PTE test takers.
In case you find it difficult to explain Describe Image PTE, learn how to describe image in PTE from our experts.
Don’t forget to write your own answer in the comment box.
PTE Describe Image Practice With Answers
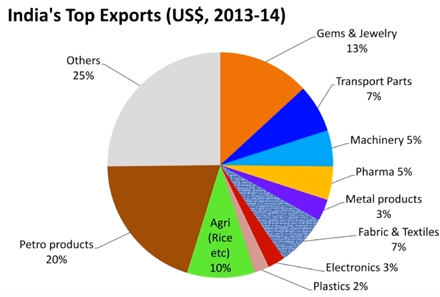
# Describe the given Pie-chart diagram

The pie chart shows the top exports from India in the year 2013-2014. The exports were measured in US dollars. The first thing that is clear from the chart is that petro products accounted for the biggest share of the exports at 20%. The next highest contributor to Indian exports was Gems and Jewellery at 13%. Agriculture sector which exports things like rice made up 10% of the total exports. Fabric & textiles and Transport Parts each provided 7% while Machine and Pharma provided 5% each. Metal Products and Electronics made 3% and Plastics were at 2% of the export. All remaining exports provided the remaining 25%.
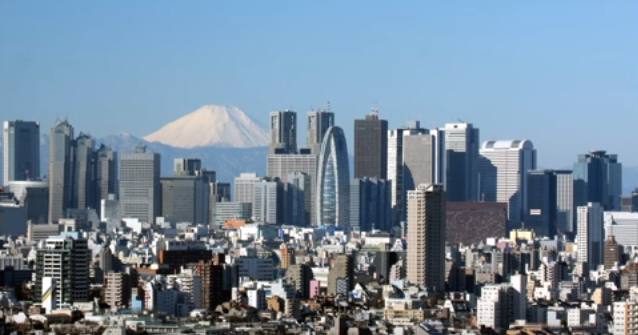
# Describe the given image

The picture shows a major city that seems to be densely populated. There are several tall skyscrapers in the background while there are a number of smaller buildings in the front. It seems the smaller buildings were built much earlier than the ones in the background. They all look like some kind of office buildings. This is probably the central business district of the city. But if you look further behind the buildings you will see a tall white mountain that seems to have had snow recently.
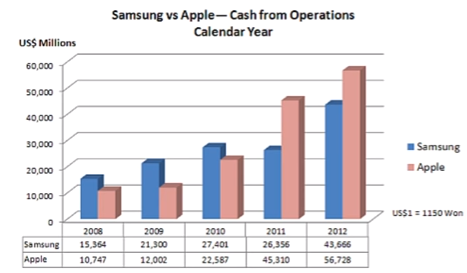
# Describe the given Bar graph diagram

The bar graphs compare the cash from operations that Samsung and Apple had in calendar years 2008 to 2012. In the first three years, Samsung’s cash from operations was significantly higher than Apple’s. In 2008 Samsung had 15,364 million compared to Apple’s 10,747 million. 2011 was the first year when Samsung fell behind Apple, registering a fall in its cash from operations. In that year Apple had almost a 100% growth reaching 45,310 million dollars. The trend continued in 2012 with Apple at 56,728 million and Samsung at 43,666.
To stay updated with more PTE Describe Image Practice With Answers, like us on Facebook.